

Linux Automation's Optick: A Glass-to-Glass Latency Measurement Tool

Optick: Glass-to-Glass Latency Measurement Tool
New Linux Automation GmbH products are often inspired by needs we observe in our day-to-day development work at Pengutronix. Today's new product, the Optick, was inspired by our graphics team, that works with different kinds of video pipelines and optimizes them based on customer demands. One such demand is minimizing the latency of camera to display video pipelines.
To make matters even more complicated the glass-to-glass latency (camera glass to display glass) will likely vary over time, with processor load, details of complex image processing or other sources of stuttering. Added to this there will always be a jitter (or beat frequency) superimposed due to the different frequencies of the signal source and shutter of the camera. (But let's not go down this rabbit hole...)
This means our latency measurement can not be a single measurement of so-and-so many milliseconds, but should instead be a histogram from which average, minimum and maximum latencies, as well as jitter can be derived.
Over time we have built multiple makeshift setups to collect such histograms, that were versatile enough to suite (at most) one measurement setup each.
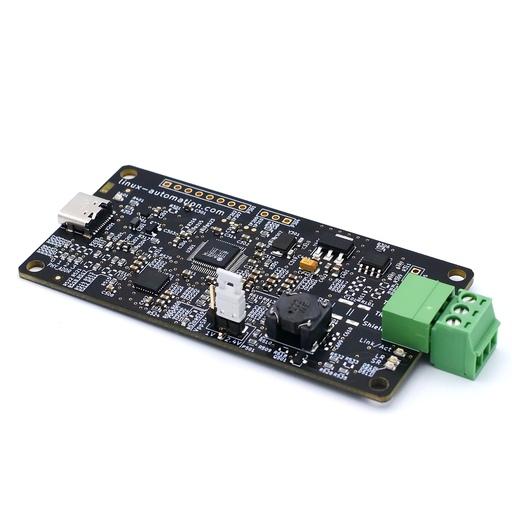
But with the advent of Optick that is about to change. The Optick is a versatile glass-to-glass latency measurement device (that can also do other timing measurement and generation tasks e.g. for Realtime Linux measurements).
How it works
The following diagram shows how a measurement with the Optick works. An LED assembly is placed in front of the camera. The DUT captures the video from the camera and does all it's video-processing-magic until the video is displayed on the DUT's display. In front of the display a photo-sensor assembly captures the brightness of the screen. The timing of the LED is precisely controlled by the microcontroller on the Optick. Capture of the rising and falling edges of the sensor signal is done with the same timebase. Thus the relative time between the two events can be captured with the precision of the on-board oscillator.
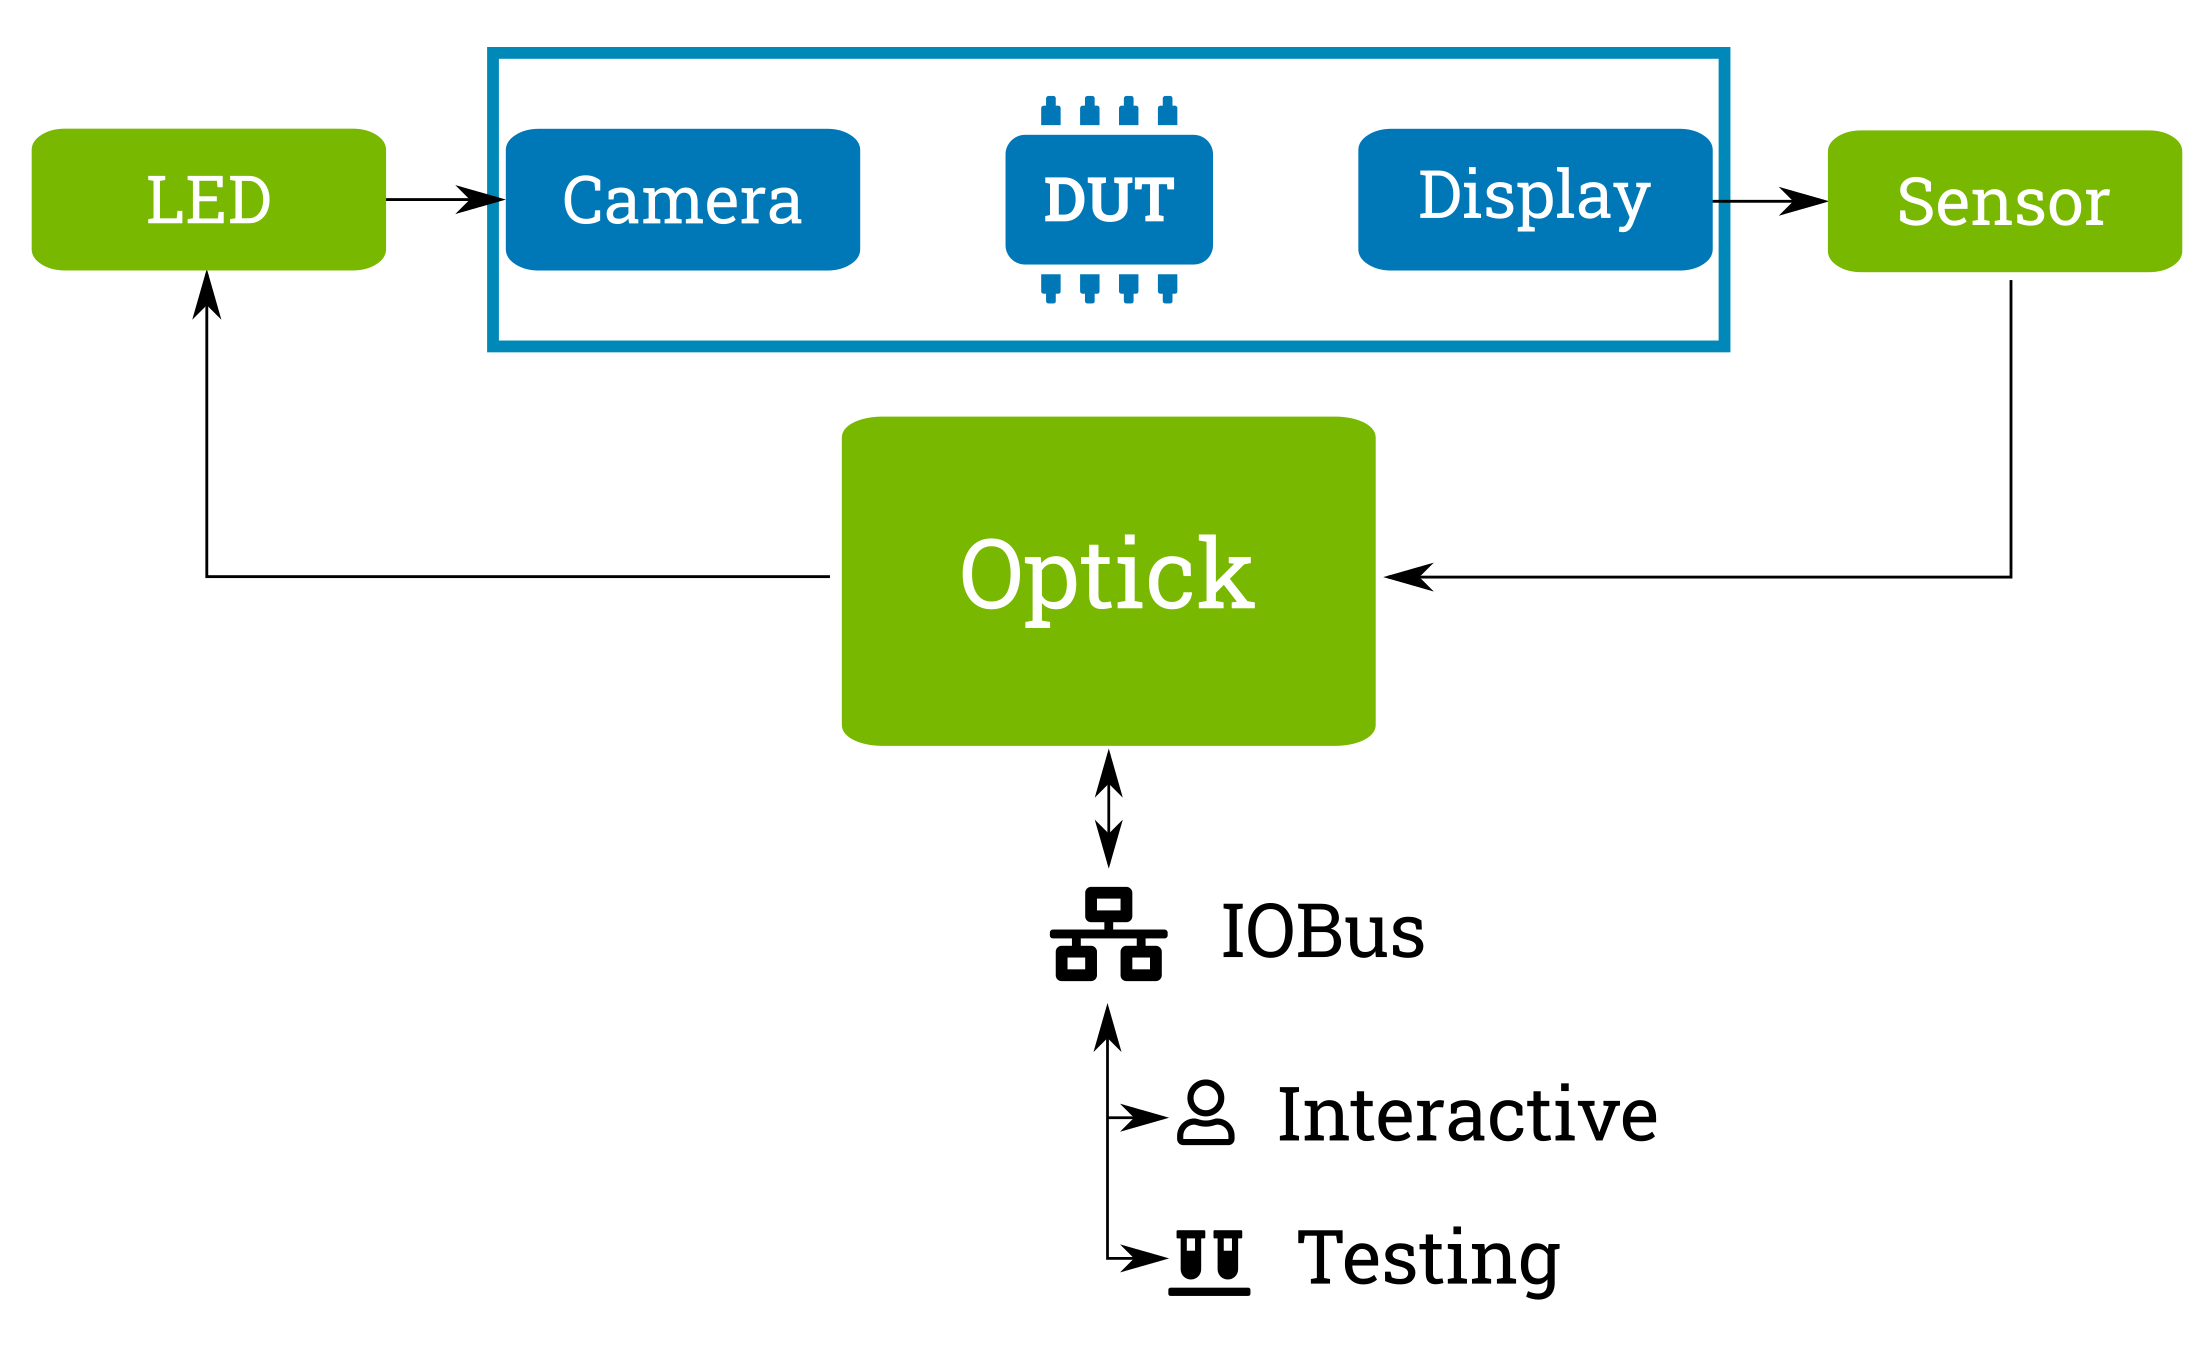
Schematic representation of Optick's measurement principle
The Optick also features a second capture channel that can either be used to capture a second glass-to-glass latency. For example one could be placed at the top and one at the bottom of the screen to detect tearing. But this channel can also be used to capture the PPS output of a GPS receiver module - just in case one will ever need an even better timing reference.
To accommodate for displays with different brightness the threshold of the sensor can be fine tuned in software.
The Optick is powered and controlled via IOBus. IOBus is an CANOpen-inspired protocol on top of CAN that allows reliable communication. Thanks to CAN as transport the bus system is very reliable - even in installations where USB bus-sizes start to cause massive headaches.
LEDs and Sensors
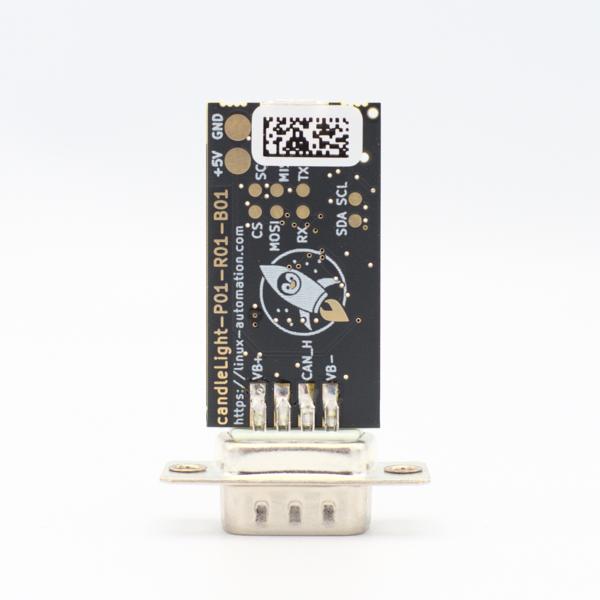
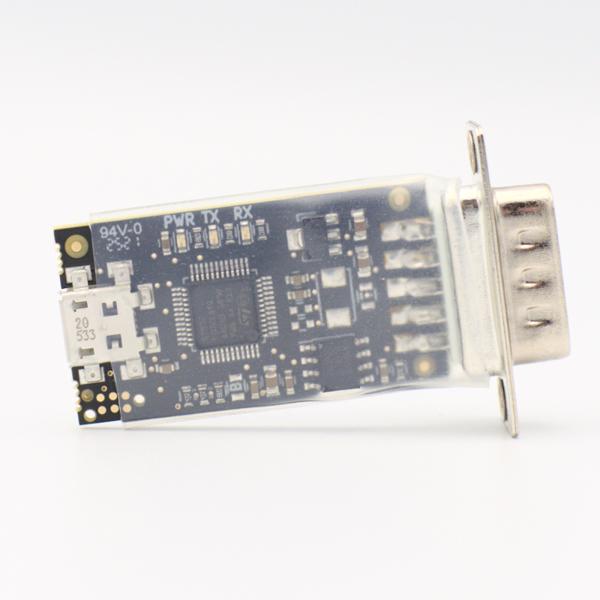
The LED and sensor assembly are connected via standard and low-cost 2.5mm audio cables. These tiny modules come with a 3D-printed housing that allows us to directly duct-tape them onto the camera and screen.
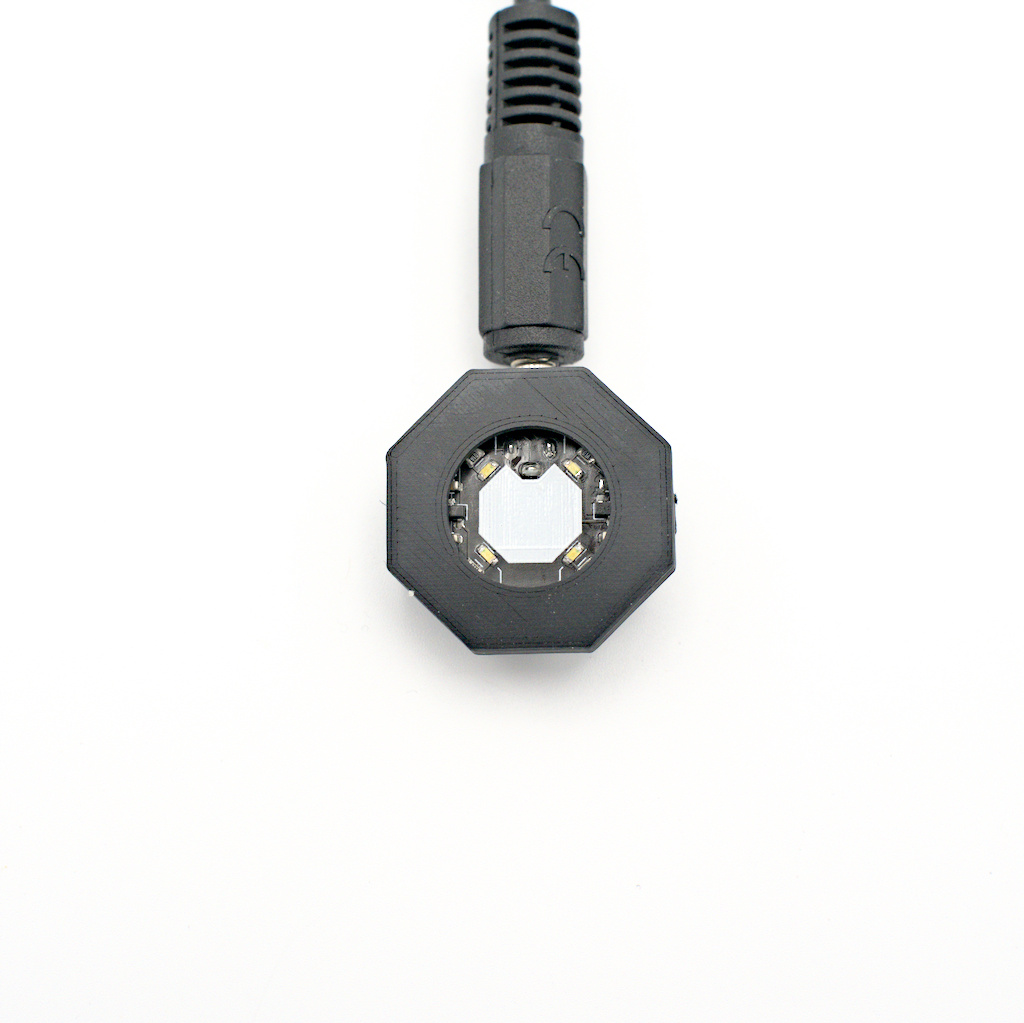
The active side of the LED assembly.
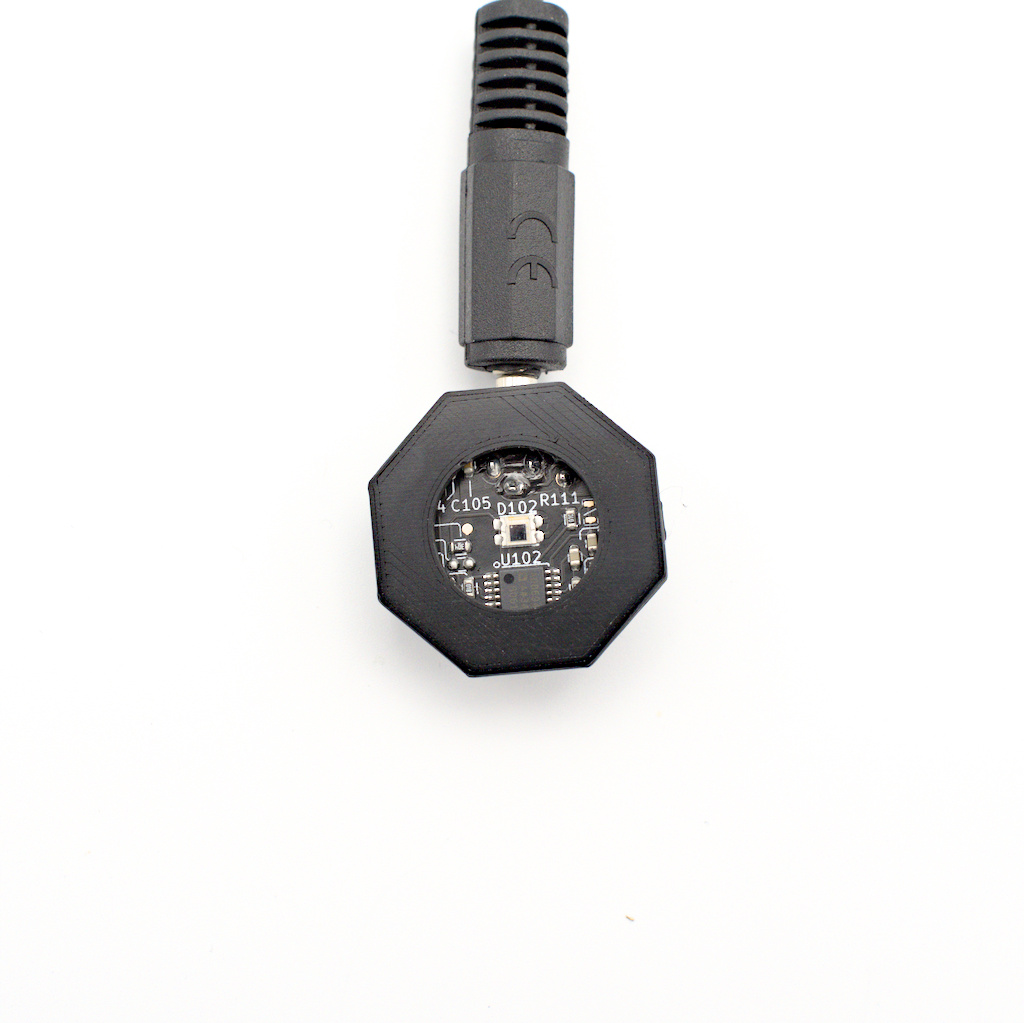
The active side of the sensor assembly.
Giving it a try
For demonstration we will measure the glass-to-glass latency of an ancient smartphone. First: The LED assembly is taped onto the camera on the back. Make sure that one of the LEDs illuminates the tiny aperture of the camera. This way we will get a bright blob on the screen when the LED is switched on.
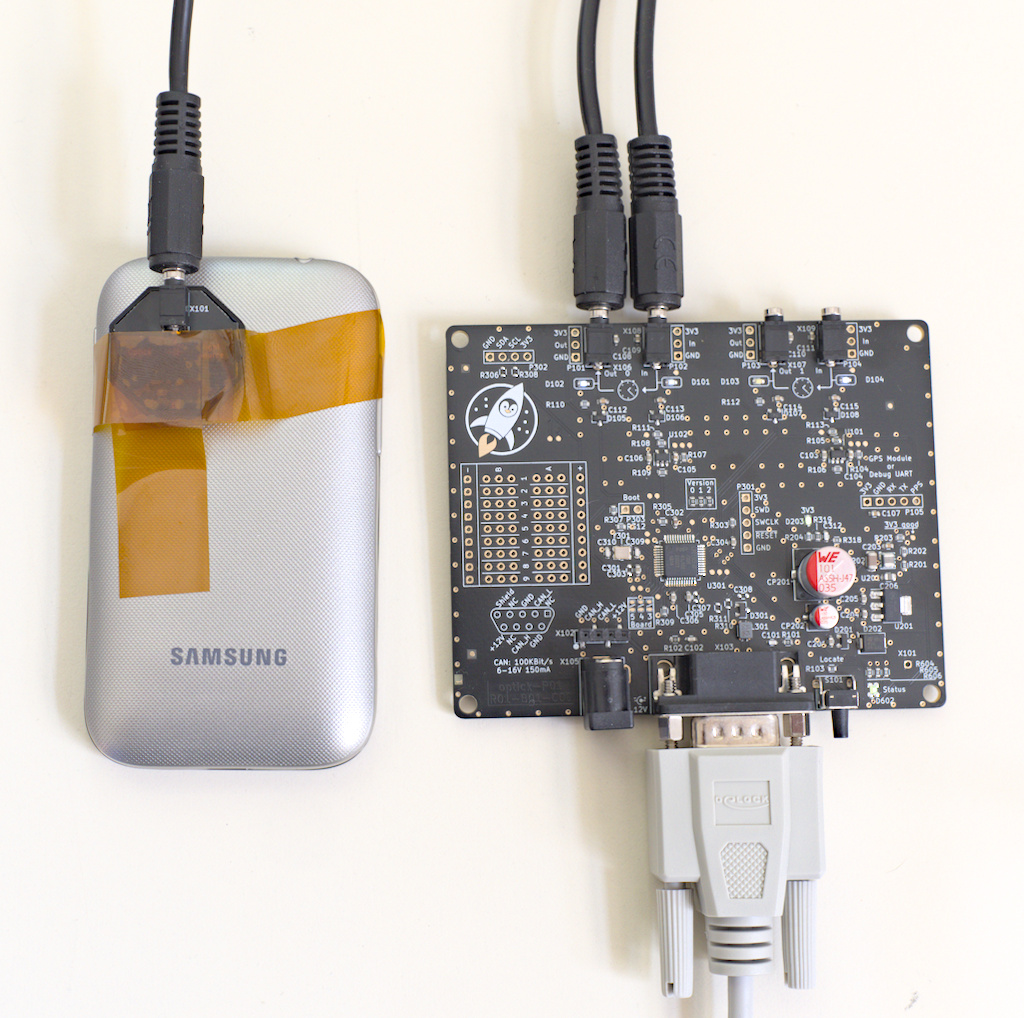
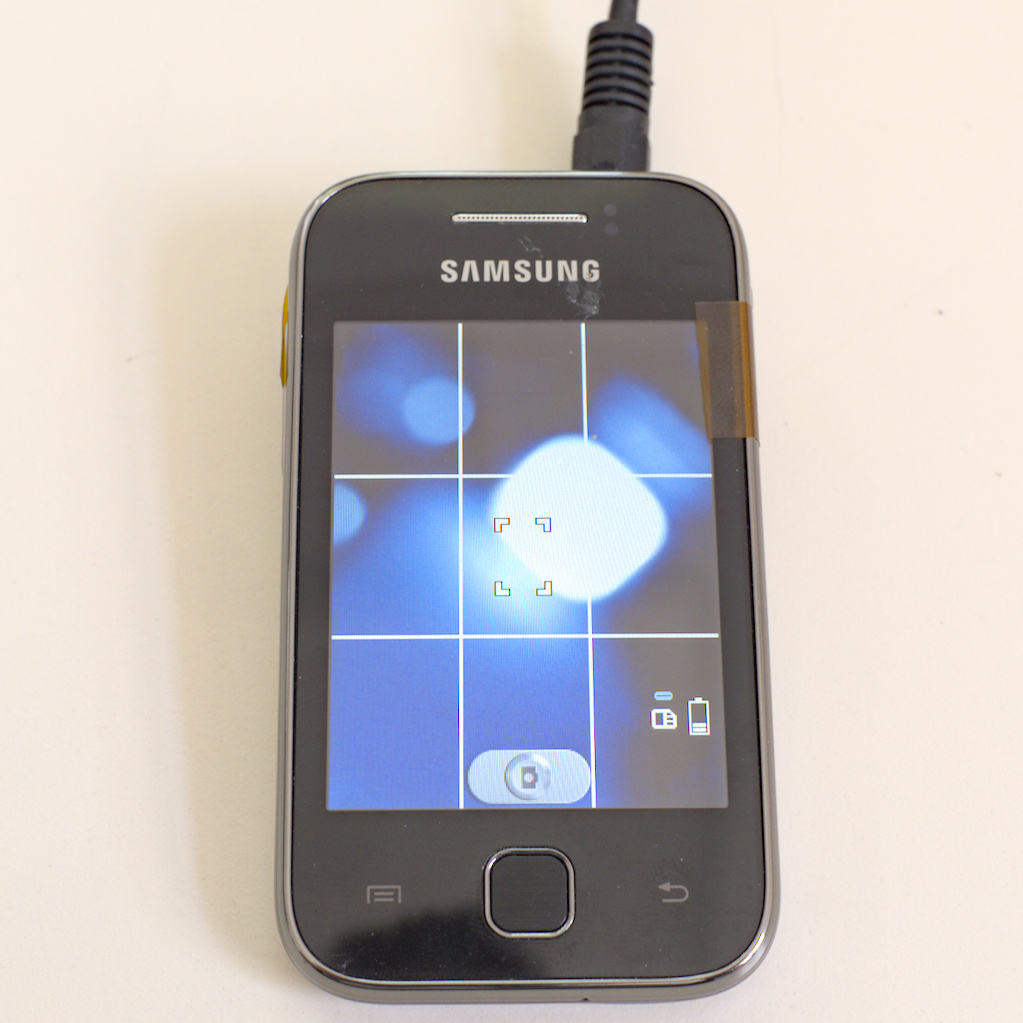
Next, we need to place the sensor assembly on the screen. Again, some Kapton tape will secure it in place.

Since the signal amplitude on the sensor depends on the screen's brightness, we need to run a calibration step first. This yields a threshold, that we can later use to capture measurements:
chris@defiant$ optick calibrate --changeover-delay 1  --output 0 Optick-00043.00001 0

Trigger level 0.24 provides:
  - 100% correct low estimates
  - 100% correct high estimates
Using a trigger level of 0.24 we can now capture a first measurement:
chris@defiant$ optick latency --trigger-level 0.24 --iterations 1 Optick-00043.00001 0 0
Timestamp (ns),Output State,Input State
0,0,0
500000000,1,0
668088166,1,1
1000000000,0,1
1235854375,0,0
To create a histogram of the actual latency we first need to take more samples and store them in a file:
chris@defiant$ optick latency --trigger-level 0.24 --iterations 100 Optick-00043.00001 0 0 > phone.csv
The Optick tool can create a histogram from these measurements. But we will need to take care of plotting ourself:
chris@defiant$ optick histogram --bin-size 0.02 csv
Bin start(s),Bin end(s),rise -> rise,fall -> fall,rise -> fall,fall -> rise
0.0,0.02,0,0,0,0
0.02,0.04,0,0,0,0
0.04,0.06,0,0,0,0
0.06,0.08,0,0,0,0
0.08,0.1,0,0,0,0
0.1,0.12,0,0,0,0
0.12,0.14,0,0,0,0
0.14,0.16,40,0,0,0
0.16,0.18,32,0,0,0
0.18,0.2,27,29,0,0
0.2,0.22,1,17,0,0
0.22,0.24,0,51,0,0
0.24,0.26,0,0,0,0
0.26,0.28,0,1,0,0
0.28,0.3,0,1,0,0
Using everyone's least favorite plotting tool LibreOffice we quickly get some diagram showing the distribution of latencies:

Where to get it
The Optick was, or rather is being, developed to suite our Pengutronix-internal needs, but we think it may also suite your needs, this is why we decided to add it to our webshop in its current, slightly prototype-y, state.
Do you want to perform glass-to-glass latency measurements, as shown above? Do you want to make other latency or timing measurements that can be performed with two outputs and two inputs and a resolution of about 21 ns?
Then feel free to contact us about it or head straight to the Linux Automation's web shop.
Weiterführende Links
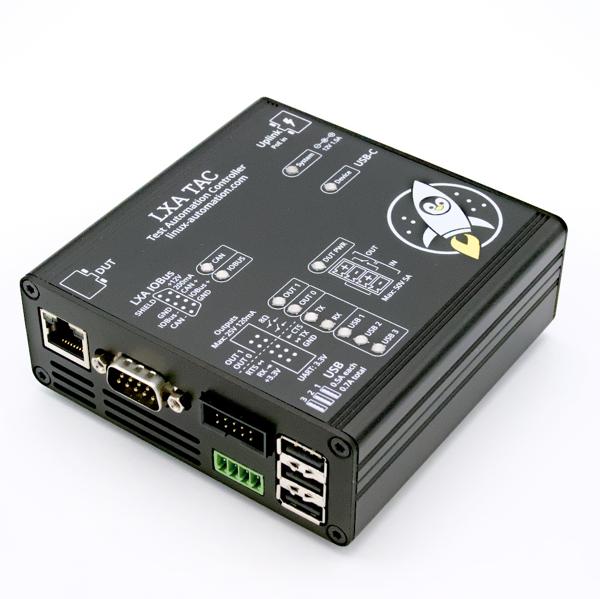
Linux Automation Test Automation Controller: Ein all-in-one labgrid Exporter
Unsere Tochter Linux Automation GmbH stellt mit dem LXA TAC (Linux Automation Test Automation Controller) einen all-in-one labgrid exporter vor. Das LXA TAC bietet die üblichen Schnittstellen, um ein oder mehrere Embedded Geräte (DUTs, Devices under Test) mit labgrid interaktiv oder automatisiert steuern zu können.
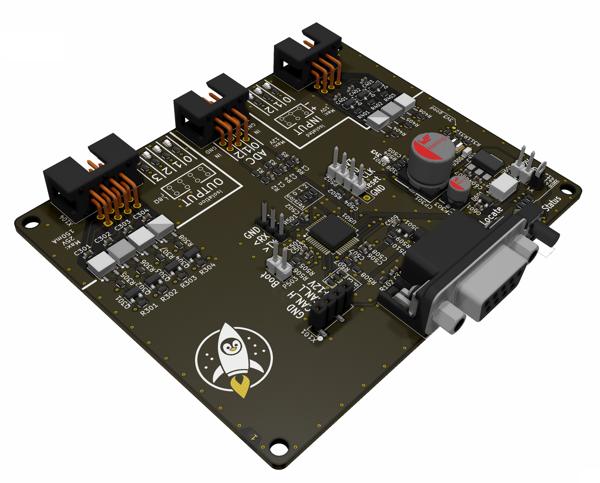
Lab-Automatisierung mit LXA IOBus
Etwas über dreieinhalb Jahre sind seit unserer letzten Produktankündigung vergangen, seitdem haben wir viele Normen gelesen, Dinge über Webshops und den Alltag der Elektronikfertigung gelernt und still und heimlich an neuen Produkten getüftelt. Heute möchte ich das LXA IOBus-System vorstellen, bestehend aus einem CAN-basierten Kommunikationsprotokoll, einem zugehörigen Gateway-Server und einer neuen Klasse an Linux Automation GmbH Produkten. Zwei dieser neuen Produkte sind der Ethernet-Mux und das 4DO-3DI-3AI Input/Output-Board.
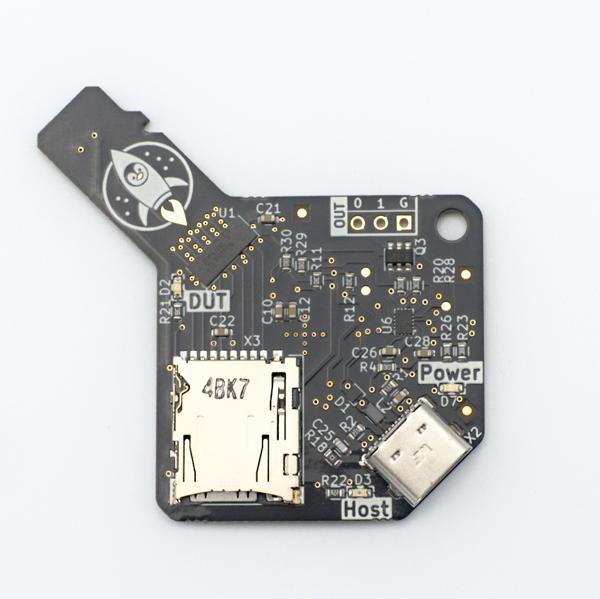
Der USB-SD-Mux ist nun FAST
Seit 2019 vertreiben wir mit unserer Partner-Firma Linux Automation GmbH den USB-SD-Mux. Damit konnten wir vielen Embedded Entwickler*innen die Arbeit erleichtern und dadurch die Softwarequalität verbessern. Zugleich schreitet die Technik voran: Micro-SD-Karten werden schneller und mittlerweile hat sich USB-C als Standard etabliert.
LXA USB-T1L ❤️ Beagle Play: Exploring Single Wire Ethernet
It seems everybody is talking about Single Pair Ethernet (SPE) these days. So we want to follow the trend and do the same :-) SPE is a class of Ethernet transmission standards that uses just a single pair of twisted pair cable for data transmission. There are multiple SPE variants spanning maximum data rates from a hand full MBit/s to multiple GBit/s and cable lengths from a hand full of meters to kilometers. The most interesting ones from our embedded-centric point of view are 10Base-T1L (point-to-point, up to 1 km), 10Base-T1S (multidrop, approx. 10 m) and 100Base-T1 (point-to-point, 15 m). The new Beagle Play comes with a 10Base-T1L PHY. This makes it a great peer to experiment with our Linux Automation USB-T1L. In this post we will explore the possibilities of 10Base-T1L on a recent Linux system.
Yes we CAN... add new features
Have you ever experienced an otherwise fine product that is missing just the one feature you need for your application?
Did you know? Initializing CAN interfaces with systemd-networkd
End of January systemd 250 was added to Debian bullseye backports. With a lots of new features and fixes now comes the possibility to set the timing of CAN bus interfaces with systemd-networkd. In this blogpost I will take a look at why this helps us maintain our embedded Linux labs.